Parse DICOM RTSTRUCT (Radiotherapy Structure Set) into binary masks using Numpy
DICOM-RTSTRUCT Contour Data
Contours drawn for radiotherapy are saved as DICOM RT Structure Set (“RT” stands for radiotherapy.) in DICOM Standard, and usually as a single file. You can locate this file among CT or MRI data sets quite reliably, by traversing recursively through the directories and looking for MODALITY of “RTSTRUCT”.
In this modality, the contours are saved as 2D polygons slice by slice under the Contour Data (3006,0050) tag, which species the data format as:
Sequence of (x,y,z) triplets defining a contour in the patient based coordinate system described in Section C.7.6.2.1.1 (mm). See Section C.8.8.6.1 and Section C.8.8.6.3.
In other words, the perimeter of a sliced contour is specified by a sequence of discrete points.
[x0, y0, z0, x1, y1, z1, x2, y2, z2, ... xn, yn, zn]
This can be reshaped to (n+1)*3, representing n+1 points along this perimeter.
pixelCoords = np.array([[x0, y0, z0],
                        [x1, y1, z1],
                        [x2, y2, z2],
                        ...
                        [xn, yn, zn],
                        ])
For example, the image below is a CT slice of a prostate phantom overlaid with these discrete points.
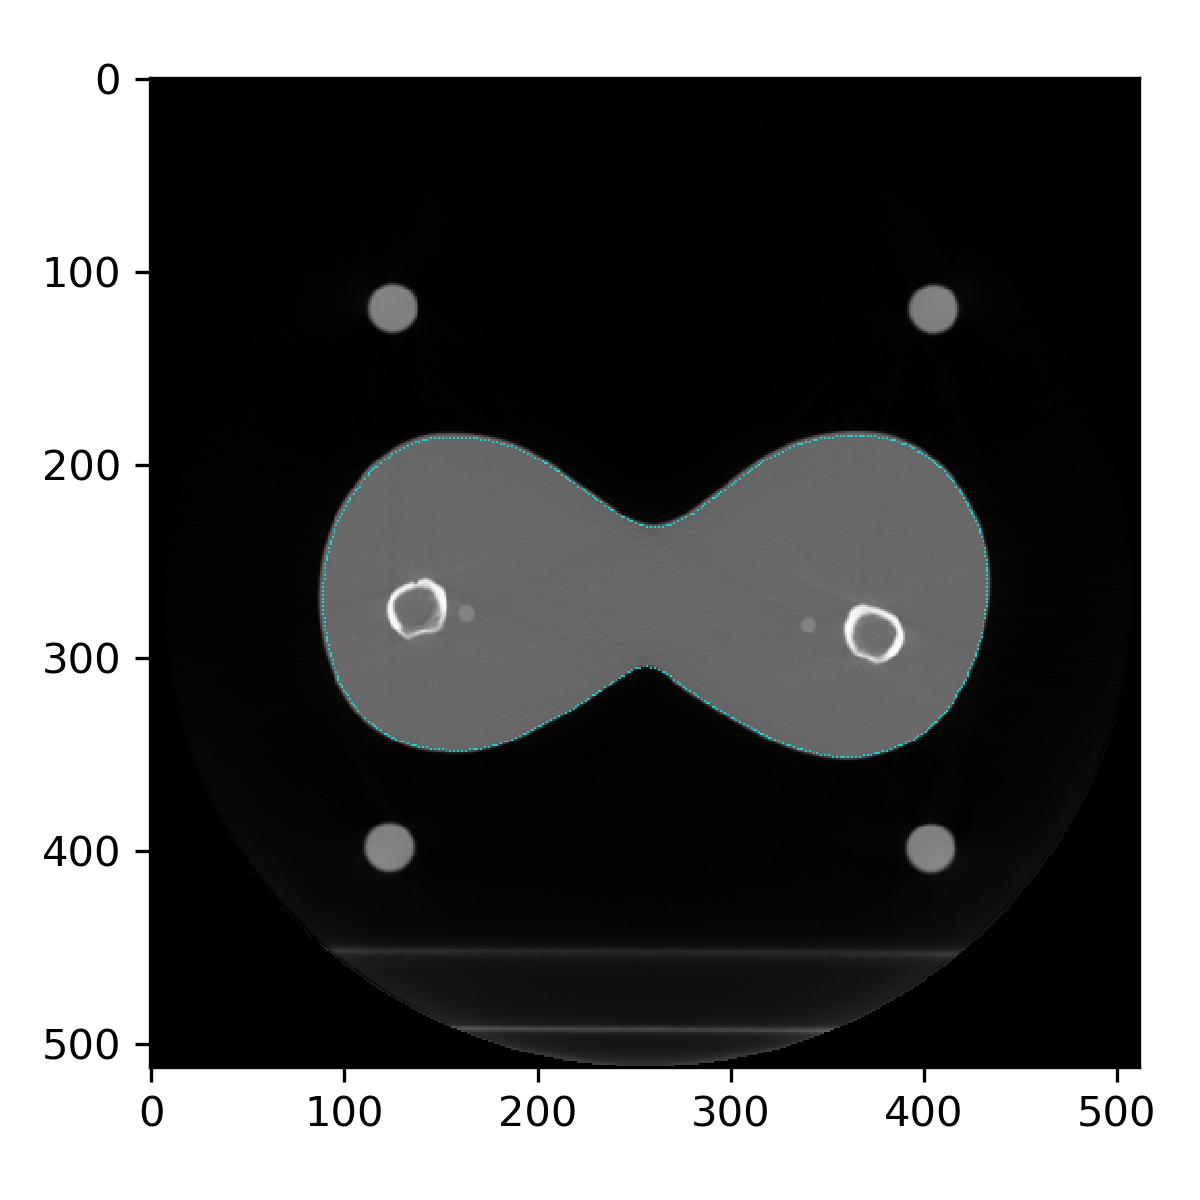
Contours as discrete points
To generate a 2D representation of these discrete points, you will need to first convert the Contour Data from real word units (mm) to Pixel Coordinates (integers).
I usually first generate an all-false boolean 2D array
import numpy as np
arr = np.zeros(shape).astype(bool)
Then change those Contour Data pixels to True using fancy indexing.
cols = pixelCoords[:,0]
rows = pixelCoords[:,1]
arr[cols, rows] = True # Note the order of indices (cols before rows)
Another approach would be using numpy.unravel_index. I describe this method in better details in a separate post.
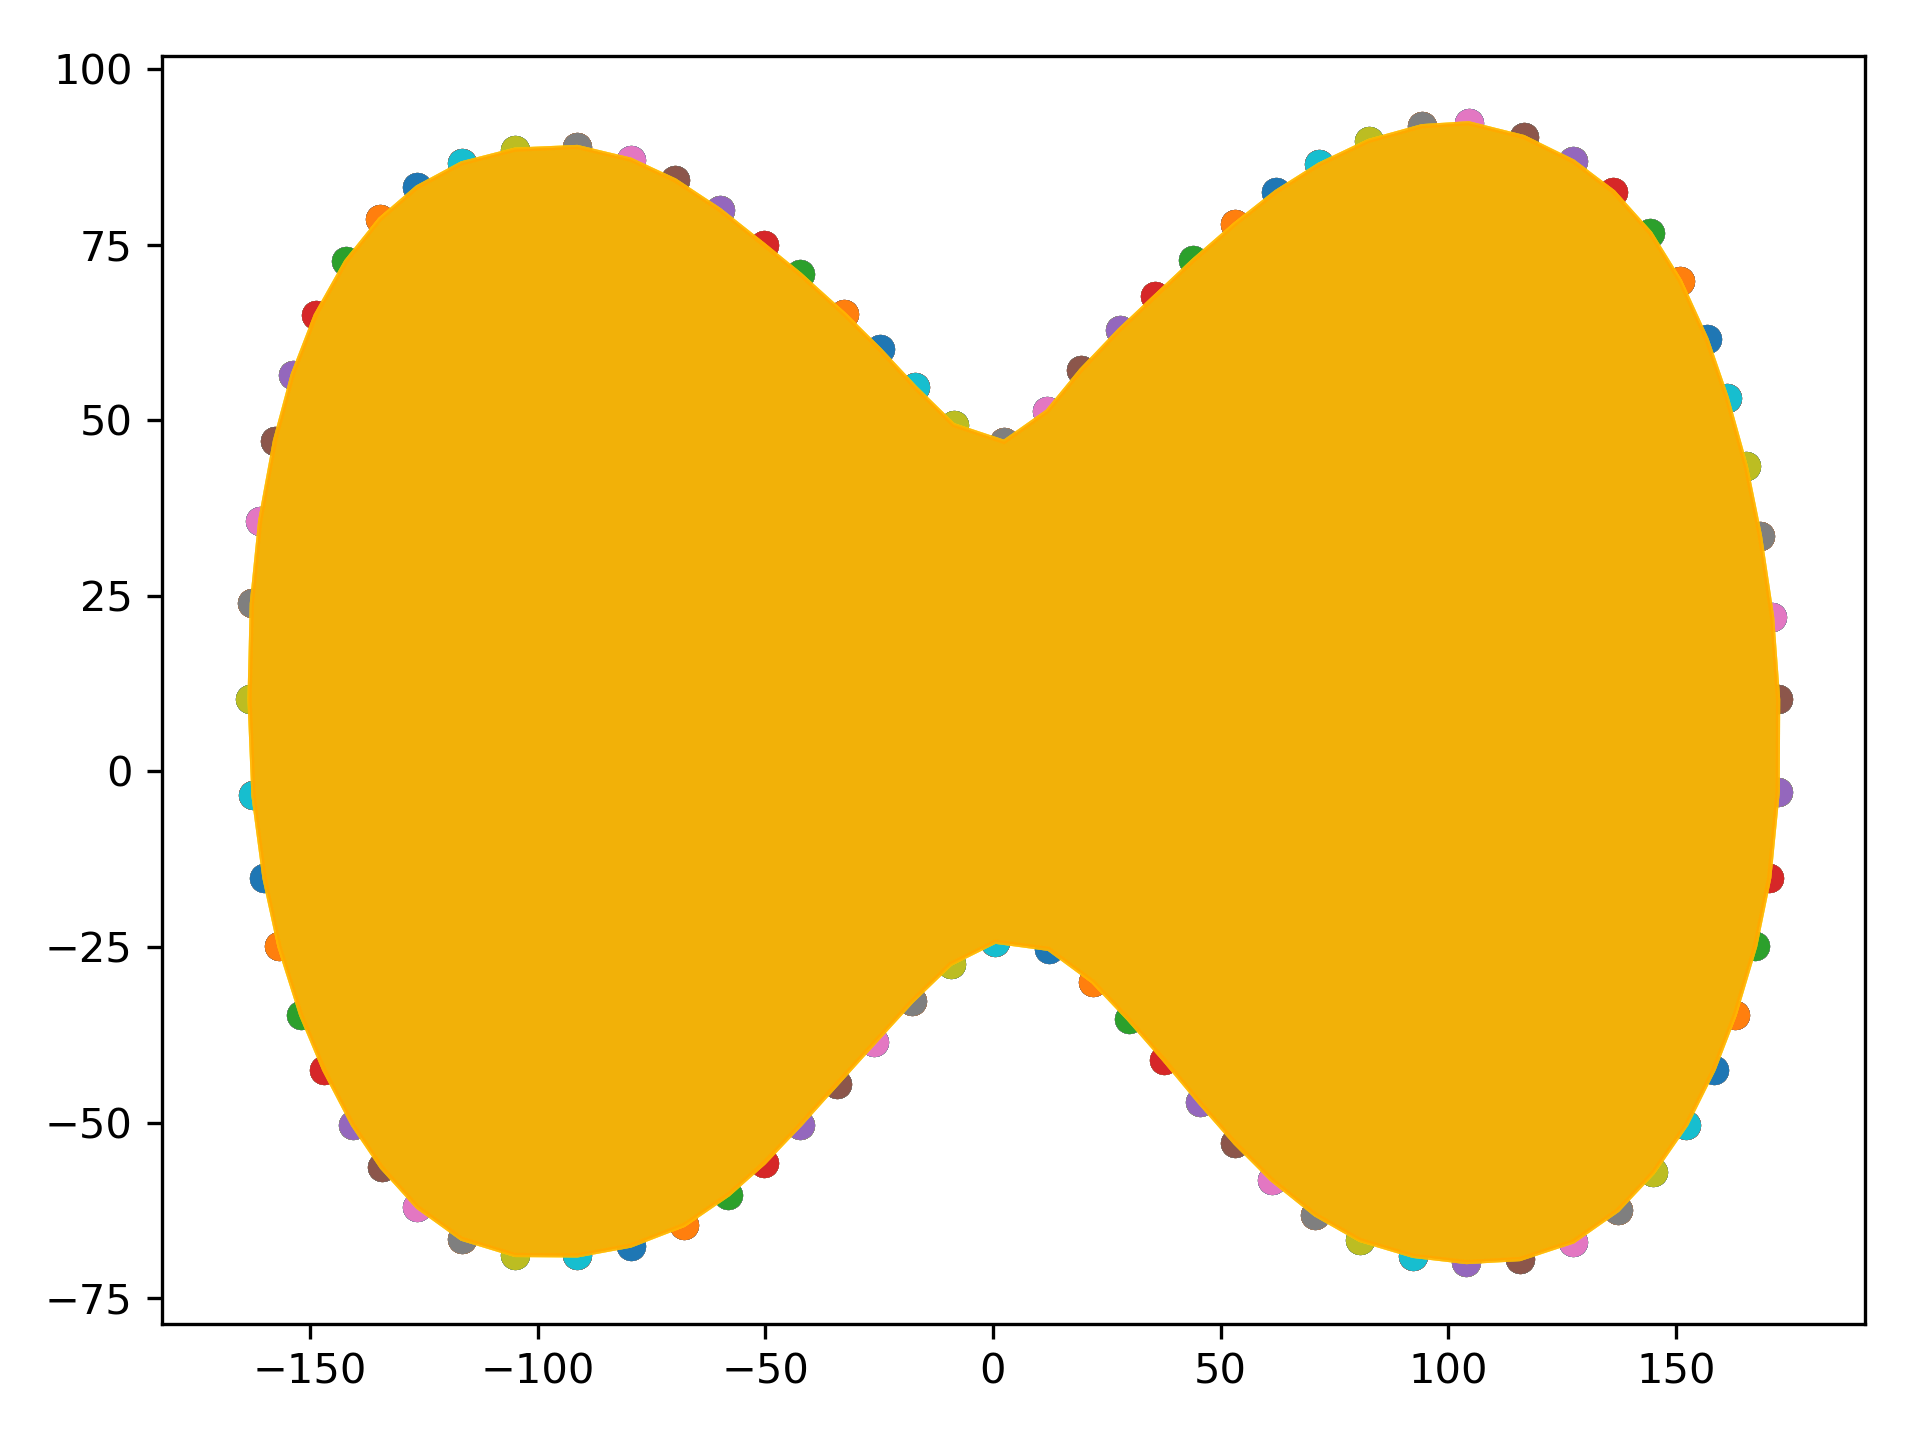
Contours as binary mask
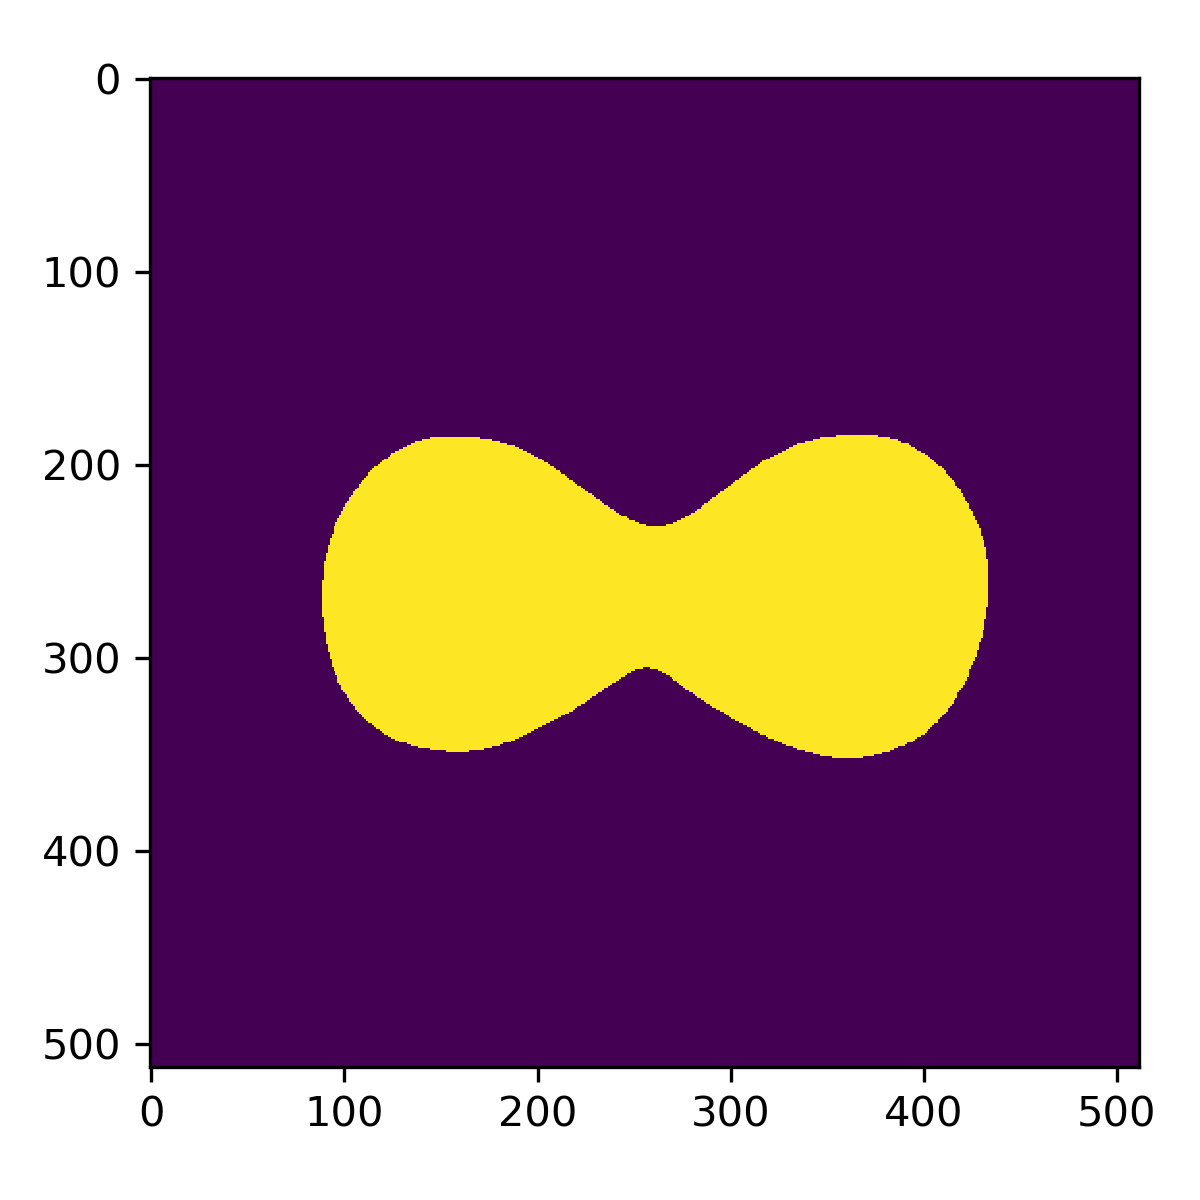
Binary masks as shown above can be useful for things like pixel-wise semantic segmentation in deep learning. To create these masks, you might attempt to treat these points as a point cloud, and calculate their alpha shape. For concaved shapes, finding the correct parameter to draw the correct envelope can be tricky. In a field that focuses as much on reducing errors and uncertainties as Radiation Oncology, this method is simply not generic/robust enough.
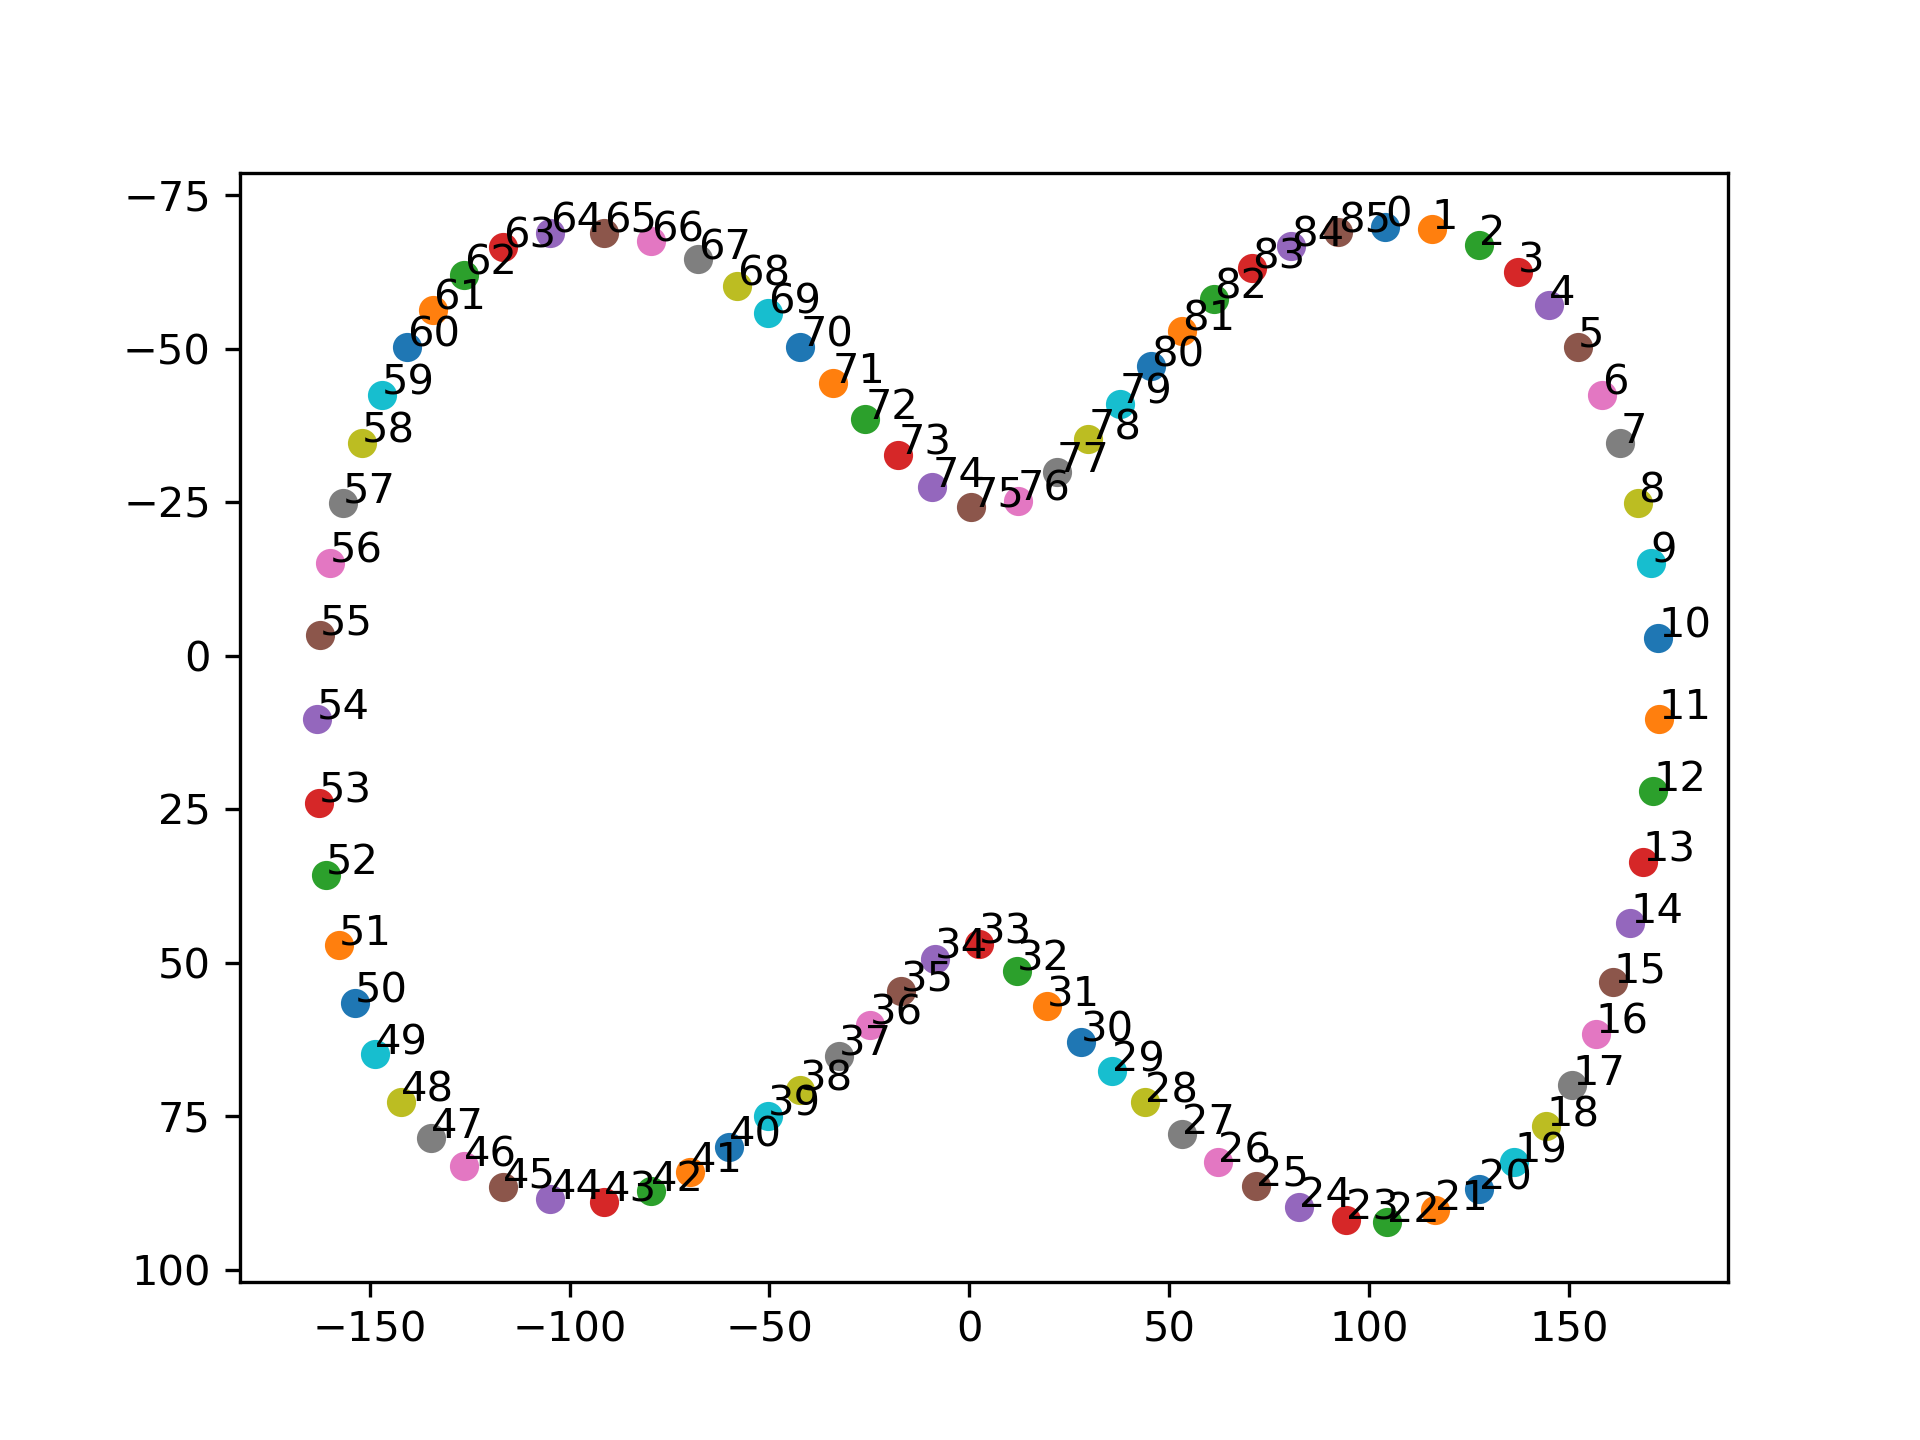
Luckily, the DICOM-RT file exported by treatment planning systems preserve the “connectivity” between the points, that is, they are saved consecutively either clockwise or counter-clockwise.
It turns out that the easiest approach to fill this contour is simply draw a filled polygon and cast that into a boolean 2D array.
You can do this with OpenCV:
import cv2
arr = np.zeros(shape)
poly = pixelCoords[:,:2]
cv2.fillPoly(img=arr, pts=[poly], color=1)
mask = img.astype(bool)
or with Scikit-image:
from skimage import draw
vertex_col_coords = pixelCoords[:, 0]
vertex_row_coords = pixelCoords[:, 1]

fill_row_coords, fill_col_coords = draw.polygon(vertex_row_coords, vertex_col_coords, shape)
mask = np.zeros(shape, dtype=np.bool)
mask[fill_row_coords, fill_col_coords] = True